Annex I: Examples of FNA Results

Philippines
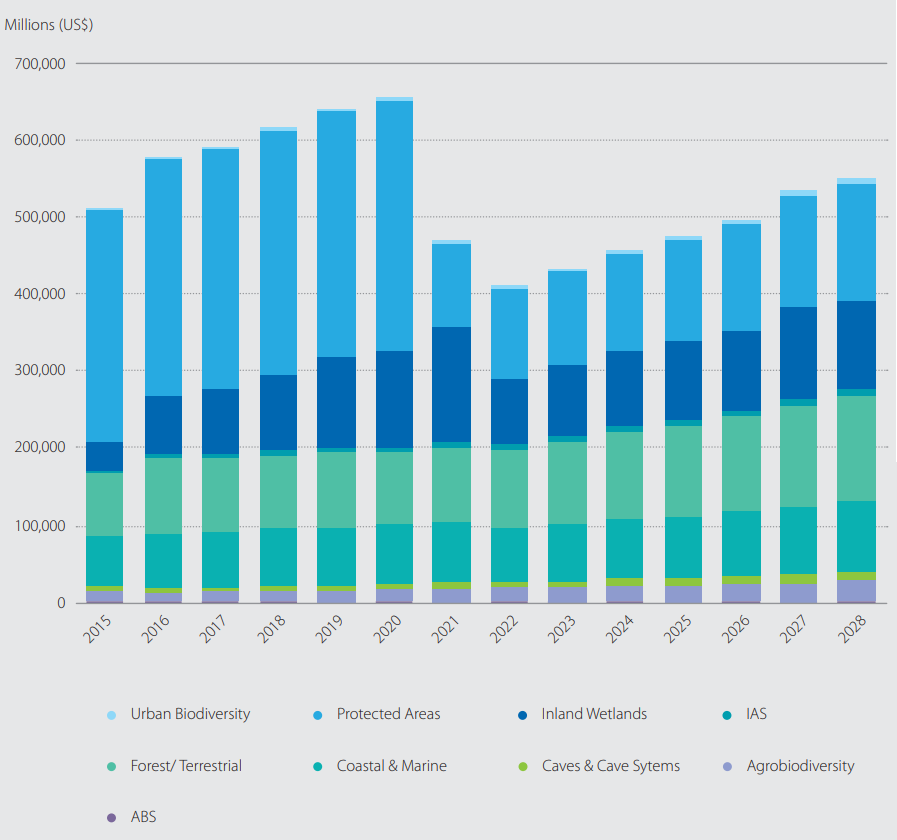
The Philippines developed a detailed PBSAP costing using an iterative process involving the main stakeholders, key experts and government officials. Figure 5.5 shows estimated costs (US$) for each year from 2015 to 2028, categorized into the main PBSAP themes. Initial costs were high due to investments associated with protected areas (PA) management efforts to relocate occupants of PAs to areas of lower biodiversity value.
Figure 5.5: Timeline of Costs for Implementing the PBSAP, 2015-2018 - The Philippines

Ecuador
Ecuador costed the eight priority results in Ecuador’s NBSAP, for a basic and optimal scenario
The basic scenario is the minimum level of funding required to operate key conservation programmes and meet basic requirements to sustain functions of ecosystems in protected areas. The optimal scenario describes the ideal state if all necessary funding, personnel, equipment, and other resources were available. This would ensure achievement of shortmedium-long-term goals for protected areas, in accordance with the highest environmental, social, and economic standards.15 The financial gap is equal to the difference between the financial needs and the existing available funding. The results for the basic and optimal scenarios are shown in Figure 5.6. For the optimal scenario, the data suggest Result 2 is already funded. Deficits are estimated for the other seven results.
Figure 5.6: Biodiversity Finance Gap Disaggregated by Result in a Basic Scenario - Ecuador

Figure 5.7: Biodiversity Finance Gap Disaggregated by Result in an Optimal Scenario - Ecuador

Endnotes
-
Or the ministry responsible for budgeting and finance.
-
Cangiano, M. M., Curristine, M. T. R., & Lazare, M. M. (2013). Public financial management and its emerging architecture. International Monetary Fund. Available from: https://www.odi.org/sites/odi.org.uk/files/odi-assets/events-presentations/1505.pdf
-
Defined in Chapter 1 (Section 1.3) through the three objectives of the CDB:biodiversity conservation; sustainable use of biodiversity; and fair and equitable sharing of its benefits.
-
Balmford, A., Gravestock, P., Hockley, N., McClean, C. J., & Roberts, C. M. (2004). The worldwide costs of marine protected areas. Proceedings of the National Academy of Sciences, 101(26), 9694-9697. Available from: http://www.pnas.org/content/101/26/9694.full.pdf
-
RBB is governed by Law No. 28411, General Law on the National Budget System, specifically in Chapter IV “RBB” in Title III, “Supplemental Norms for Budget Management”.
-
Department of Marine and Coastal Resources ( 2012). An Analysis of Results from Modelling of the Impact of Sea Level Rise on the Upper Part of the Gulf of Thailand (in Thai). A Report Prepared by TESCO Co. Ltd. for the DMCR. Available from: https://www.researchgate.net/publication/260166201_Recent_estimate_of_sea-level_rise_in_the_Gulf_of_Thailand
-
See more at: http://www.focusintl.com/RBM062-RBB(2012)4_en.pdf
-
Flores, M., & Bovernick, A. (2016). Guide to improving the budget and funding of national protected areas systems. Lessons from Chile, Guatemala and Peru. United Nations Development Programme, New York. Available from: https://www.cbd.int/financial/guides/undp-rblc-pabg.pdf
-
Organisation for Economic Co-operation and Development. Development Assistance Committee. Working Party on Aid Evaluation. (2002). Glossary of key terms in evaluation and results based management. Available from: http://www.oecd.org/dac/evaluation/2754804.pdf
-
Public accounting practices may differ from country to country and be fully or partially aligned to international standards. The United Nations Statistics Division and the International Monetary Fund provide guidance material on budget classification and formulation, which is relevant to costing.
-
For example, monitoring surveys on endangered species and/or habitats may be conducted less than annually, say every 3, 5 or 10 years, depending on practicality in the scarcity of the biodiversity in question.
-
World Health Organization (2014). Cost effectiveness and strategic planning (WHO-CHOICE). World Health Organization. OneHealthTool. Available from: http://www.who.int/choice/onehealthtool/en/
-
Most BIOFIN countries have been able to link expenditures with costs in the BIOFIN categories, but only at the highest levels.
-
Bovarnick, A., Alpizar, F., & Schnell, C. (2010). The Importance of Biodiversity and Ecosystems in Economic Growth and Equity in Latin America and the Caribbean: An economic valuation of ecosystems. United Nations Development Programme, 2.
-
Flores, M., & Bovernick, A. (2016). Guide to improving the budget and funding of national protected areas systems. Lessons from Chile, Guatemala and Peru. United Nations Development Programme, New York. Available from: https://www.cbd.int/financial/guides/undp-rblc-pabg.pdf